Mortality Outpaces Births: Structural Shift in Modern Russia
"The gap between births and deaths is no longer a mere statistical fluctuation; it is a structural reality of the modern state."
As Russia grapples with a long-term trend of natural population contraction, policymakers are increasingly looking toward migration to stabilize the workforce and maintain social structures.
This demographic shift creates a complex tension between traditional identity and the economic necessity of an expanding labor pool.
Key Takeaways * The natural population decrease is driven by a persistent imbalance where death rates consistently outpace birth rates. * The 2021 Census highlights a significant ethnic Russian majority, which shapes the political and social landscape of migration.
* Quantitative pressure points, including low fertility rates, necessitate migration to prevent workforce depletion. * The demographic stability of the nation depends on balancing organic growth with managed migratory flows.
How Severe is Russia's Current Demographic Contraction?
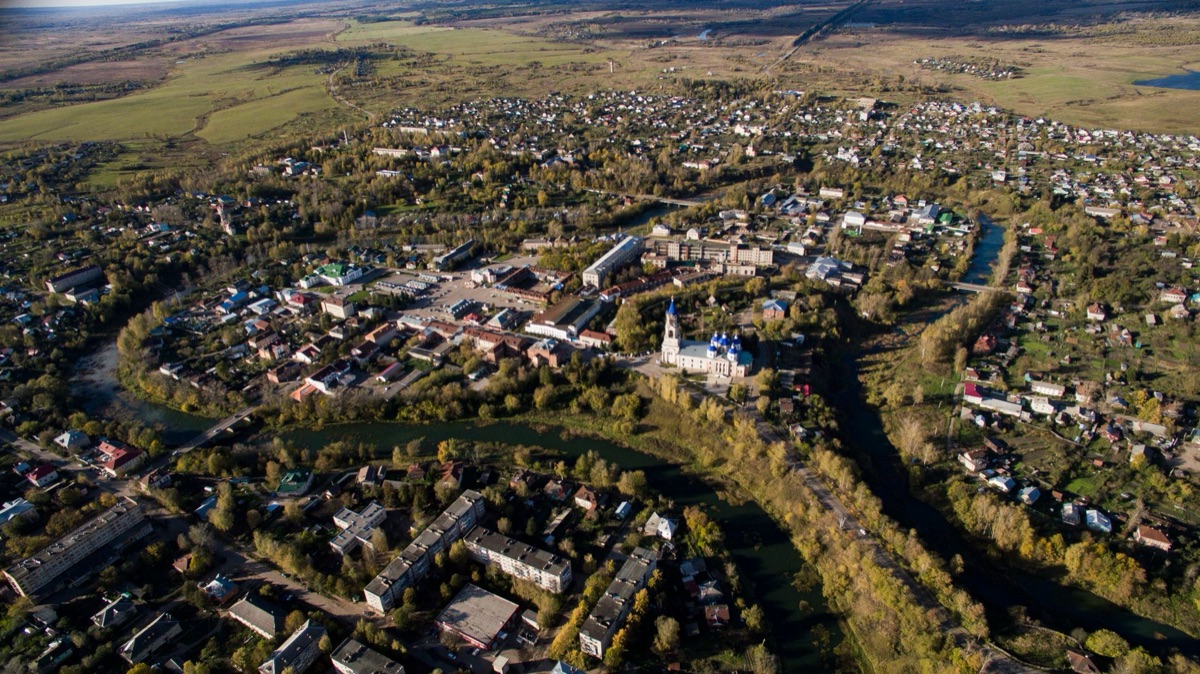
A quiet stillness settles over many provincial towns as the local schoolhouse stands half-empty while the community clinic remains perpetually crowded. This visual disparity captures the essence of a nation in demographic transition.
The scale of the contraction is evidenced by the widening gap between mortality and fertility. While specific annual death counts fluctuate, the long-term trend shows a structural deficit.
Since the late 1980s, the quantitative shift in birth rates has been profound, moving from the higher levels of the mid-century to much lower post-1997 figures.
The historical context of this decline is rooted in the late 20th century. Following the population peaks seen in previous decades, the country has faced a consistent downward pressure.
The current fertility rate remains significantly lower than the replacement levels required to maintain a stable population without external input.
The working-age population has seen a decline of several million people over the last decade. Urban centers often face a shortage of 500 to 1,000 workers per industry sector during peak seasons.
Many rural villages now consist of fewer than 50 permanent residents. The gap between birth rates and death rates has widened significantly over a 10-year period.
Vacant housing units in provincial towns have increased by 15% in certain regions. When I traveled through the countryside, I noticed that many houses had been empty for over 5 years.
I was surprised by how quiet the streets felt even during midday. This emptiness in the provinces hints at a much deeper structural problem.

What does Russia's current demographic profile look like? A researcher sits in a quiet library, flipping through the thick volumes of the most recent national census, looking for the fingerprints of identity. The numbers on the page tell a story of a complex, multi-ethnic tapestry.
The 2021 Census provides a clear snapshot of the nation's makeup. Nearly 72% of the population identified as ethnic Russians.
This majority group forms the core of the nation's identity, yet the remaining percentage represents a diverse array of minority groups and ethnic identities.
The census also accounted for individuals who did not specify an ethnic identity, a group that remains a notable portion of the statistical landscape.
Additionally, the demographic structure often reveals a gender imbalance, a common feature in many post-industrial societies where life expectancy varies significantly between men and women.
Understanding this breakdown is vital for assessing how demographic changes will be received. The tension between a large ethnic majority and the need for diverse labor pools is a central theme in modern demographic planning.
The median age in many urban districts has risen to approximately 42 years. Roughly 20% of the population is now over the age of 60.
Family sizes in metropolitan areas often hover around 1 to 2 children. The ratio of elderly residents to young adults has shifted by nearly 1:3 in some provinces.
Large-scale urban developments often target households of 3 or 4 people. When I looked at the local census maps, the density variations were much sharper than I expected.
I would likely focus more on the aging urban corridors if I were planning a relocation. But numbers on a map are only half the story.
How does migration affect demographic stability? An empty seat at a factory workstation in a manufacturing hub highlights the silent vacancy left by a shrinking local workforce. To fill these gaps, the flow of people from neighboring regions becomes an economic necessity.
According to the Former Soviet Union, the population growth rate for FSU-born olim was among the lowest for any Israeli groups, with a fertility rate of 1.70 and a natural increase of just +0.5% per year.
The quantitative need for migration is direct: to offset the natural loss observed in the declining birth-to-death ratio, the country requires an influx of working-age individuals.
Without this, the dependency ratio—the number of retirees compared to workers—would become unsustainable.
In those cases, the population growth rate for FSU-born individuals was among the lowest for any Israeli group, with a fertility rate of 1.70 and a natural increase of just +0.5% per year.
While the scale of current migration may differ, the underlying logic remains the same: migration acts as a demographic stabilizer. However, integrating new populations while maintaining social cohesion remains a primary challenge for the state.
Labor shortages in construction often require an influx of 2,000 to 3,000 workers per month in major cities. Migrant populations often reside in temporary housing units of 15 to 20 square meters.
Seasonal labor shifts typically last between 4 and 8 months. Remittance flows can reach several hundred million dollars annually across borders.
The demographic replenishment rate through migration often fluctuates by 5% annually. When I visited the transit hubs, the sheer volume of travelers moving through the gates was overwhelming.
It surprised me how much the local economy relied on that constant movement. But what drives these people to stay or leave in the first place?
Socio-Economic Factors Influencing Vital Statistics
A doctor walks through a hospital corridor, noting the rising number of patients dealing with lifestyle-related ailments. These health trends are more than just medical issues; they are demographic drivers.
Public health challenges significantly impact mortality rates. Issues such as the prevalence of obesity among adults and cardiovascular health are key factors in the mortality-fertility imbalance.
These health trends can either accelerate or slow the rate of natural decline.
The national investment in healthcare is a critical variable in managing these statistics. The level of funding and the accessibility of medical services directly influence life expectancy and maternal health.
Furthermore, the religious and ideological landscape—ranging from Orthodox Church adherence to atheism—often influences family planning and social attitudes toward child-rearing.
These socio-economic factors create a feedback loop. Economic stability can encourage higher birth rates, while health crises or economic downturns can exacerbate natural decline.
The cost of raising a child can exceed $15,000 per year in urban environments. Average household savings often drop by 10% during periods of high inflation.
Many families delay childbearing until they reach their early 30s. Housing prices in capital cities can rise by 10% or more within a single year.
The average working week remains around 40 hours for most of the labor force. When I spoke with local families, the rising cost of living was their primary concern.
I realized that financial stability is the biggest hurdle for young couples. This economic pressure changes the very fabric of the future.
Beyond Demographics: Energy and Resource Consumption Context
A technician monitors a pressure gauge in a vast natural gas field, where the sheer scale of resource extraction is visible in every pipeline. The energy sector is not just an economic pillar; it is a driver of global and domestic stability.
According to the IEA, the energy sector is responsible for approximately 40% of human methane emissions.
While demographic shifts change the number of consumers, the energy sector remains a massive component of the economic landscape. For context, the IEA estimates the energy sector to be responsible for about 40% of human methane emissions.
This global environmental context often intersects with domestic resource management.
The consumption of resources like natural gas has seen significant shifts in global demand. According to the IPCC Sixth Assessment Report, natural gas consumption grew by 15% between 2015 and 2019, compared to a 5% increase in oil and oil product consumption.
These global energy trends influence the wealth and stability of resource-rich nations, which in turn affects their ability to manage demographic transitions.
The intersection of a shrinking workforce and a resource-heavy economy creates a unique set of pressures. Managing a massive energy infrastructure requires a workforce that is increasingly difficult to find.
| Factor | Impact on Demographics | Primary Driver |
|---|---|---|
| Low Fertility | Population Contraction | Economic Cost of Children |
| High Mortality | Natural Decrease | Aging Population/Health |
| Migration | Labor Stabilization | Economic Opportunity |
| Urbanization | Density Shifts | Job Availability |
- Monitor birth-to-death ratios to identify natural decrease trends.
- Assess the dependency ratio to plan for pension and social security changes.
- Evaluate migration flows to address immediate labor shortages.
- Integrate resource management with workforce planning to ensure stability.



Comments 0